 Vegetation
Maps
  Vegetation
Maps
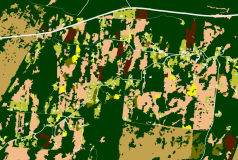
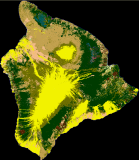 2005
Hawaii Hawaii High Res Land Cover (NOAA C-CAP)
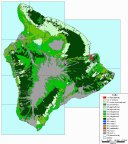 Older: 1:100,000
LULC (land use/land cover) from the USGS
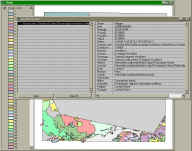
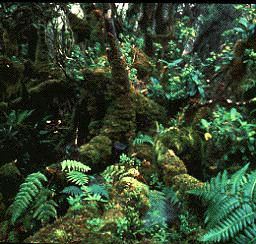 supposedly it is.
| the annual rainfall is a contour map, like this: |
however, we need a height field, so i filled in the contours using PhotoShop such that the green value gives the rainfall in inches per year: |
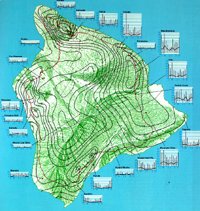 |
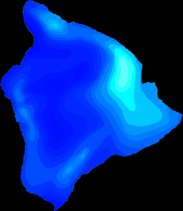 |
| the vegetation zone map uses cross-hatch patterns, like this: |
i filled in the regions with solid colors so it can be quickly queried: | here's the legend for the filled map: |
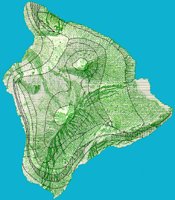 |
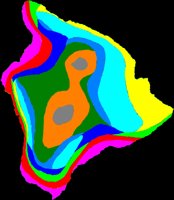 |
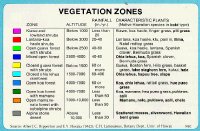 vegetation.txt |
| Caption: "This map actually show potential vegetation, that is, the vegetation that one might predict could develop in an area, given the climate and the plant species currently present in that area. It does not take into account the vegetation, or lack thereof, in urban areas and does not depict modifications resulting from plantation agriculture, pasture, and similar factors." | ||
| vegetation type | 31 herbaceous rangeland |
32 shrub and brush rangeland |
33 mixed rangeland |
42 forest |
61 and 62 wetland |
74 rock |
| 1 | 3600 | 1657 | 34 | 3728 | ||
| 2 | 13 | 3242 | 3367 | 843 | 1710 | |
| 3 | 813 | 423 | 2140 | 7 | 636 | |
| 4 | 137 | 2196 | 1488 | 2079 | 1047 | |
| 5 | 2082 | 989 | 3051 | 7 | 198 | |
| 6 | 1158 | 746 | 17683 | 17 | 487 | |
| 7 | 15 | 1414 | 491 | 4641 | 1318 | |
| 8 | 252 | 7154 | 1270 | 4505 | 2959 | |
| 9 | 5695 | 651 | 188 | 8799 | ||
| 10 | 164 | 11 | 13 | 2700 |